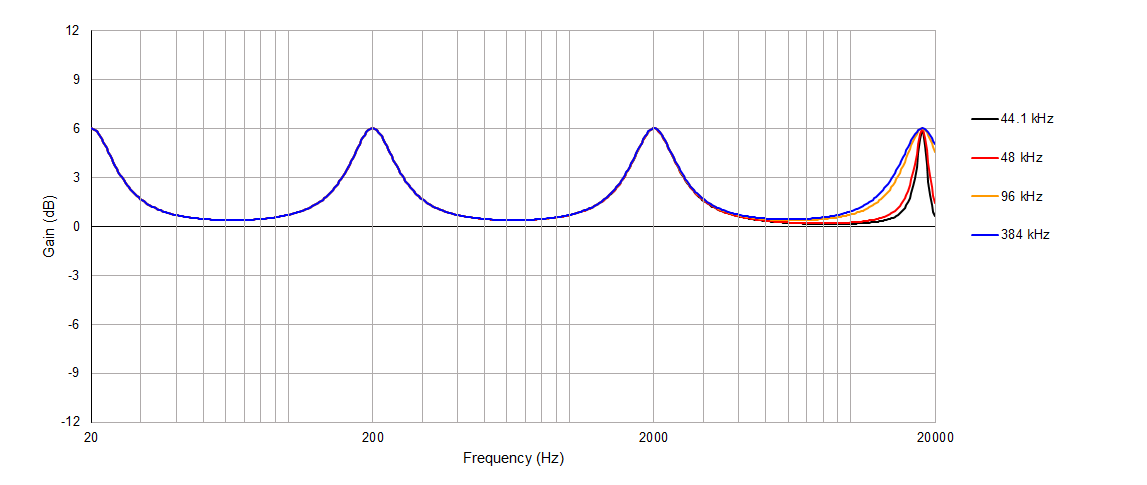
So I learned something interesting today. EQ APO primarily uses what’s known as RBJ Filters for its parametric EQ functionality. A characteristic these filters have is they become skewed as your center frequency, f0, approaches your Nyquist frequency (sample rate / 2). My plot below demonstrates this. Notice how they are all practically identical until you get close to 20 kHz. The implication here is the sample rate setting in Windows can affect how your EQ setup actually sounds. So my recommendation would be to just use a high sample rate of 96 kHz or more.
This plot was generated for frequencies of 20, 200, 2000, and 18000 Hz. Gain was set to 6 dB and Q was set to 2. The filters were evaluated for the 4 sample rates listed.
This behavior can also be observed using the EQ APO plot tool as well. Just load it up once with a low sample rate. And then reload it with a high rate set.