Ah perfect. I should have known the files would be on the AutoEQ Github.
Glad it’s what you wanted.
You’ll quickly discover that the data are linear below 100 Hz and logarithmic above. If you ever find a way to generate the missing logarithmic values below 100 Hz, I’d love to know about it.
Are you talking about the Harman curve points? I’m not sure what you mean. The frequency points are all logarithmically spaced apart.
I open harman_over-ear_2018.csv. The integer frequency numbers from 20 to 100 are all present in the frequency column. But after 102 frequency numbers are gradually skipped. For example, there is no 103 or 116. By the time you get up to the kilohertz range the gaps are about 10 hertz wide, and keep getting larger.
But for the samples to be logarithmic below 100, apparently there would need to be fractional-hertz sampling. Upshot: when I tell the spreadsheet to plot the raw column the curve is radically foreshortened below 100 hertz. For example:
The range from 20 to 100 Hz occupies roughly the same width as the range from 100 to 200 Hz. But the parallel ranges from 200 to 1000 Hz or 2000 to 10,000 Hz are much wider.
My original question is if you need to logarithm-atize (so to speak) the 20 to 100 Hz range yourself I’d love to learn how it’s done. But certainly don’t labour over it otherwise.
Okay so the spacing between 20 Hz to 100 Hz is not correct. I think that’s an issue with your graph software. Is the chart type set to scatter plot? Is your program automatically guessing how the x axis should be configured? Maybe you need to manually configure a setting?
I’m using MS Excel and that’s not an issue I’m having.
Thanks! I’m using the on-line Google Docs spreadsheet as recommended by someone on the forum in place of the free spreadsheet that came with my MacBook. Neither seems to have sufficient configuration options to force a particular x-axis type. Not surprising that I would need to buy a full-featured product to get results like your example.
When do graphs matter? I’m guessing for audio manufactures that try and please most of the people all of the time?..we as audiophiles trust our ears and chosen source end device combinations no?
As most sites and reviewers measure, only when comparing on the same measurement rig to get a rough estimate how headphones compare.
Not all that much.
Yeah mate I do look at them… I guess it gives you and idea of what the manufacture was sonically aiming for?
On Apple products you are so restricted and limited software wise. Windows OS is much more open regarding software but restricted regarding OS itself. Linux is completely open but not all commercial softwares are supported.
If you are more knowledgeable and more tech savvy, stay away from Apple.
Mac versus PC – that takes me back about 20 years!
I knew this but I’m not at all familiar with the Diffuse-field curve - what’s that?
The two key types here are diffuse and free. Keep in mind that all of this is based on speakers in a room.
Basically diffuse field is the result of sound waves bouncing off walls, so some of them cancel each other out, and reinforce each other, etc.
Free field is the result of only the direct sound, and assumes no reflections or sound waves bouncing off other surfaces.
I was working on the following when John_W_Clark posted the (correct) answer, but maybe this will still be of interest to anyone willing to go a bit further down the rabbit hole:
We can measure the frequency response from bass to treble of room loudspeakers simply by putting a microphone in front of them. But we can’t do the same for headphones because they need to be flush-mounted to a human head to function properly. The listener’s head is where the microphone needs to be. So instead we can insert a tiny probe microphone into a listener’s ear canal to measure the sound arriving right in front of the ear drum.
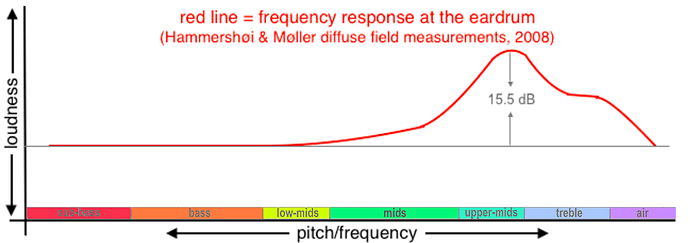
Diffuse field means equal loudness of sound coming at your ears from all directions simultaneously. The goal is to measure equal loudness sound at the ear drum to see how the sound arriving at the ear drum differs from equal loudness sound before it enters the ear.
What we find is that the shape of the outer ear + ear canal acts as a natural amplifier – but only of high frequencies:
By the middle of the 1990s it had become fashionable to design headphones that attempted to reproduce this response curve (for example, the AKG 501). These sounded shrill, even painful, at louder listening levels, but this is what a naive understanding of the theory said should be accurate, so many people convinced themselves that this is indeed how headphones should sound.

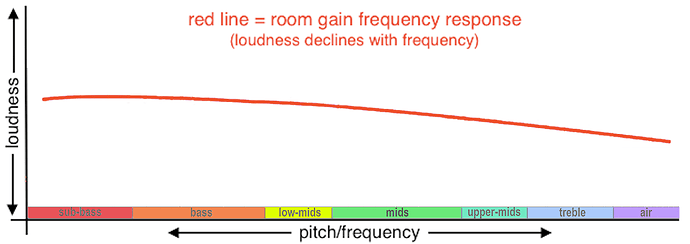
In fact, however, it’s only the outdoor world that sounds anywhere close to diffuse field. Indoor sounds, including music venues, are the result of the initial sound source plus sound reflections off the walls, furnishings, etc. These reflections have the opposite effect to what our ears provide. They amplify the bass frequencies rather than the mids and highs.
The following curve, called the Brüel & Kjær Optimum HiFi is the result of measuring many concert venues both large and small. It shows how lower frequencies are louder than higher frequencies in acoustically excellent spaces. (The word gain = amplification and is typically used in this context):
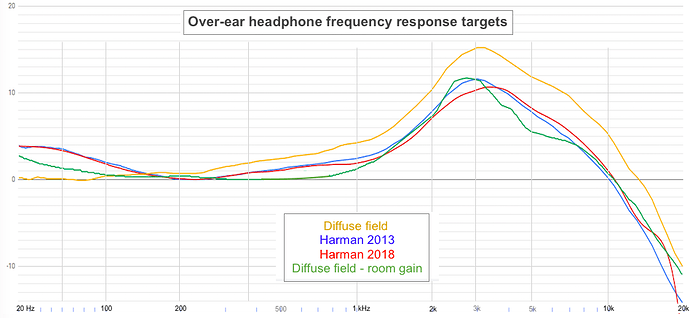
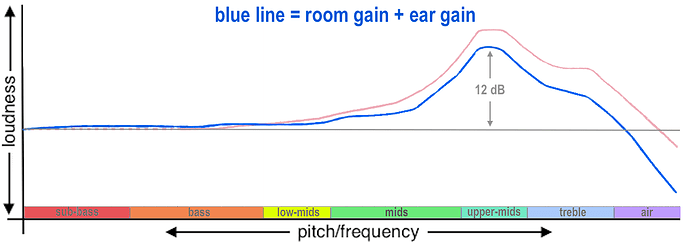
When you combine this room amplification with the diffuse field ear amplification you get the kinder, gentler curve we see in the blue line in this graph:
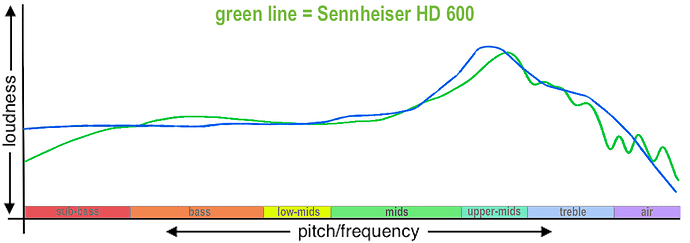
Sennheiser may have been the first to realize that room gain needed to be factored in as well as ear gain. In the 1990s they released first the HD 580 then later the HD 600 which nearly matched this second curve:
However, they marketed these and subsequent models as simply being diffuse field tuned, making no mention of the critical room amplification adjustment that they actually included. The HD 600 is still sold and valued for its natural/accurate frequency response to this day.
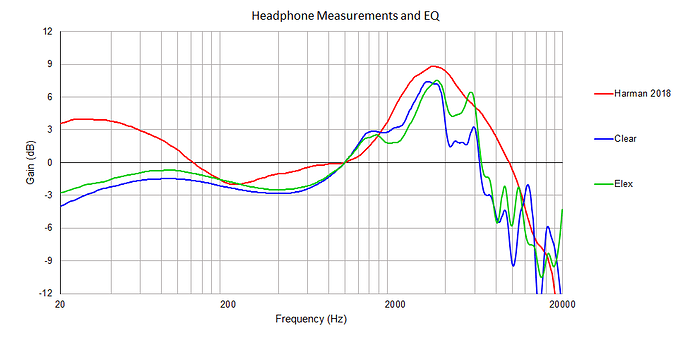
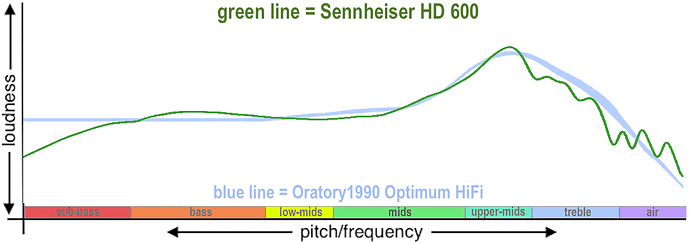
In fact, the HD 600 is more nearly neutral than the last graph shows. Here is another version showing the HD 600 against the latest thinking on headphone accuracy:
In this graph the blue line abandons diffuse field. Instead, it combines very sophisticated measurements of an accurate loudspeaker taken at the ear drum and including the ear drum’s own response but done without any room gain influence. The resulting frequency response is combined with the Brüel & Kjær room gain curve we saw in the second graph above. (BTW, Brüel & Kjær is pronounced broil & care.)
The upshot of all this is that these days when someone describes a headphone as diffuse field tuned, they in fact most likely mean diffuse field plus room gain. And ultimately they’re simply trying to specify a headphone with an appropriate amount of ear gain but with no boost in the bass.
When “FLAT” was the goal, then one should take the inverse of that graph and tune their headphone to that inverse (raised Bass, lower Treble). Or am I being dumb here?
Neither deaf nor dumb, grin. You’re simply noticing an important point that I didn’t include. Thanks to the magic of psychoacoustics our brains extract the faint extra detail in the upper mids and treble that this ear amplification provides. Then it does some further processing and feeds an UN-amplified version of the signal to our conscious minds. IOW, the inversion you mention is done by the signal processing activity of the brain.
The problem is that the brain expects to find ear gain in the signal. So if you were to listen to a signal that was actually flat by the time it reached the ear drum, what you’d hear would be an upper mids plus treble deficient sound. The brain would have removed too much loudness from that region of the audio signal.
That would produce a “net flat” line.
I am pretty sure most of us would think it sounds bad / weird / wrong.
It is interesting that most of our differences in how we like tonality tend lie in the shape of the curve around that upper-mid peak, and what we think should or should not be happening in the bass or sub-bass region. Almost all preferences can be expressed in those two points.
Also huge kudos to @MaynardGK for the super detailed trip down the rabbit hole, thanks for the background and history. Thanks !!
Funny that we all talk about the HD600. Also note the reason the SHP9500 is so popular is that it is basically a budget version of the HD600 that is more comfortable. Obviously they aren’t quite the same sound quality, but the frequency responses are very similar, and they even have the same rolled off bass.
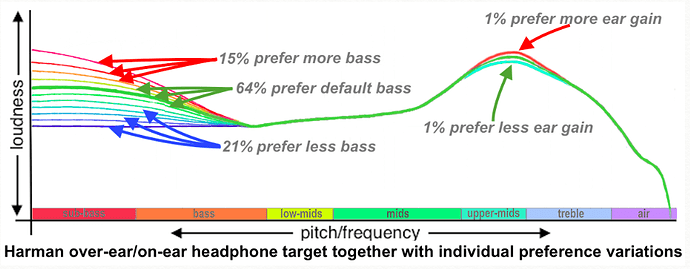
Agree. What blows my mind is how little disagreement the Harman testing found in upper-mids preference:
While bass preference covered a wide range.
I mean, you can always rely on confirmation bias and cherry picking to show their ugly head in studies.
Or you gather enough data so any arbitrary correlation can be found. Example by Matt Parker
