why are the low end bass / sub bass so smooth but when you get into mids and highs, it gets so chaotic?
why is bass so easy to produce well while the rest is not?
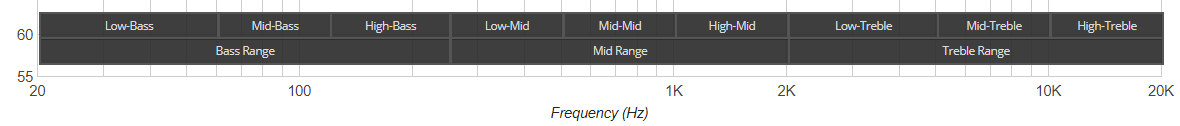
why does low end take up so much of the chart in comparison o the mids and highs?
why are the low end bass / sub bass so smooth but when you get into mids and highs, it gets so chaotic?
why is bass so easy to produce well while the rest is not?
why does low end take up so much of the chart in comparison o the mids and highs?
question 1: the lower you go the longer the wave length. longer wavelengths are easier to control because the driver has to move less often. also answers question 2.
question 3: frequency response charts are typically laid out in accordance to how well technology can accurately measure wavelengths. as you go higher, the length of the wave gets very very small. and it makes it hard to tell 1 wave from another with typical gear. and typical gear measures up to around what the average person can actually hear.
Also the charts have scaling. I used to use REW for measuring my truck and I could make the graph look super smooth and simple or really chaotic (even bass) by changing the scale/smoothing.
are you saying that as the mids n highs start to display they change the scale so it’s different than how the bass / sub bass display?
No generally when scaling is applied it’s applied to the whole graph. I say generally because I’m not sure if there is a program out there that can scale different sections.
What joshua_g said is accurate.
If you want to play around with this stuff Dayton audio makes a cheap mic setup $100ish and I believe REW is free.
scale changes smooth out response graphs is all. if you go micro enough in your measurements, ie say the vertical lines are 1db between, everything looks like a roller coaster. if you use 5db/line(typical for most) it looks much more pleasant. if its a 10db scale(have seen a few), its most likely a peaky bugger that they are trying to hide.
Great explanation
That is an artifact of the X-Axis being logarithmic. So for 10 times the frequency, the axis takes the same distance: (example: Rtings)
It isn’t.
Most of what is important sonic information wise happens between 100 Hz and 8 kHz (give or take), so anything above 10 kHz is more of a “for your information” than “very important”.
The logarithmic scale represents that, a linear scale would present 0 to 10 kHz and 10 kHz to 20 kHz as equally important.