I don’t either, but I just bought 2 of the same amp from different companies because I’m neurotic enough to care about pointless differences that ultimately don’t matter… ![]()
![]()
1 Like
I am not asking everyone to do that.
I am however expecting self respecting outlets to put the effort in to document their testing methodology to the point where it makes their effort with itself.
My bad with phrasing, I should have said prominent people who measure headphones. It’s really not feasible for someone who just wants to have fun with his minidsp ears as you say
You might want to watch this vid to see if you find it interesting, it’s the first thing that comes to mind:

(It contains a few errors but is otherwise a good overview.) If still interested, Tyll’s tutorial series can be found here:
BTW: Important to realize that Tyll’s frequency response graphs always present the data in two ways. The upper graph is an unfortunate carry-over from an earlier era. The lower is the raw presentation that we still use today.
2 Likes
I am interested and will check it out thanks for the info.

1 Like
Boy, that would be a beautiful thing. Would love to see an example of it being implemented.
1 Like
Here is the guide from HP, published in paper alongside their network analyzers in 1997
http://na.support.keysight.com/8720/applicat/app3.pdf
A more recent slide deck from Keysight on the subject of accuracy:
This may be premature but I think I’m getting a vague glimmer here. Here’s my understanding of the context:
A headphone FR graph is made using two very special mics at the eardrum position of a dummy head where everything is designed to mimic the acoustic characteristics of a hypothetical average auditory pathway including resonances and impedance. A 20 to 20k Hz sine tone is fed to the headphone being measured and the SPL for each frequency as picked up by both mics are captured as digital values by a computer running the test software.
Is this even tolerably correct? And if so where would you capture the test signal you propose introducing to this system? If it’s possible to explain in electronics-illiterate terms, that is.

FYI apparently Zeos never looks at graphs.
…And he still said “buy this now” about the Tin P1s… (flattest frequency response I’ve seen in earphones/headphones, except for the 10khz hole).
I like frequency graphs, but they are missing so much info on the headphone. I wish i could get to a show or dealer and listen to them. Unfortunately i cant do that. Look at this Graph of the Focal Elex:

Isnt it beautiful? So nice and straight. Looking at this i would be impressed with the Elex. Look at it in comparison with the 650’s. Elex has no slant in the bass, no dips in the treble like the 650. I would conclude the Elex is better than the 650’s with this.
Now look at this graph for the Sendy Aiva:
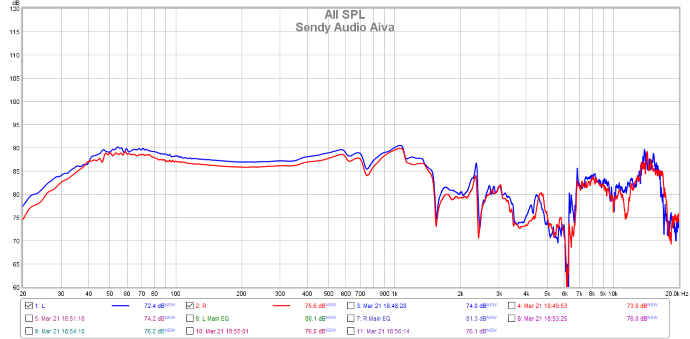
This graph looks to me like a mess, theres a dip in the bass theres a terrible ravine in the midrange and weird dips in the treble. Looking at this graph would definitely scare me away from the Aiva’s. but its one of the best headphones i heard. wonderful.
Idk, i wonder sometimes if their good for anything at all
1 Like
They are good for certain aspects, but you are correct they don’t tell the whole story. I just dislike when people try to take this very subjective hobby and try to objectify everything
The best way is to hear it for yourself, but obviously for most people that is not an option.
Also those are two separate graphs from different people, so be weary to that too lol. If you really want to compare FR graphs, get them from the same source and make sure they were measured on the same system with the same compensation applied (if they aren’t raw)
Definitely. I look at graphs uh… way too often, maybe, and the “google image search” for, i.e., “HD58X graph” will show 10 different graphs… and half will be inaccurate for your ears.
For example, I tend to trust rtings because their measurements are what I hear. But you may have different ears… and prefer Inner Fidelity graphs, for example.
…And I don’t trust massdrop graphs.
Again, to each their own.
1 Like
[Not sure how this got marked as a reply to M0N, I made it as a reply to MazeFrame.]
Very nice illustration! Sure hope this gets noticed and put into place. Something has to be done.
Here are the raw measurements of three different headphones each done by the three different technicians:
– Lies, damn lies and FR graphs, part 2 –

There’s enough variance after 1 kHz to sink two battleships plus an aircraft carrier. A competent rig used by a competent technician should agree within the limits of unit-to-unit product variation.
The conventional wisdom is that this means we can’t compare measurements between different measurement rigs+technician combinations. That’s enough of a pain. But I’m not seeing any evidence that any one of them is reliable from one headphone model to the next.
I can understand that going from the old straight-tube ear canal to a anatomically correct ear canal would cause issues. But even identical equipment seems to produce significant differences in results. Until this is ironed out FR graphs are no more reliable than subjective verbal reporting so far as I can see.
Here’s a practical example. I have a DT 1990. For EQ the Oratory measurements are the only ones that work, but they work very well. I also have an M50x. Not one of the three FR graphs produces anything like an accurate EQ result. I’m sure pad wear explains part of the difference – but surely only part. To get the M50x to match the 1990’s tuning I have to tune the M50x entirely by ear.
IAC, we all seem to be on the same page. I’m just adding yet more examples.
2 Likes
Really the best way if you cant hear it is to listen to a review. Zeos is good because he seems to like a lot of different types of sound from headphones and gear. And he has a LOT of experience cause of all the different headphones and gear hes heard. So i’d consider him a more neutral source.
Although he loves the Nueman NDH20’s. I dont understand how anyone could love a headphone like that lol. So its about taste also. One guy can love something i hate. So its best to get as many opinions as i can to get a better picture. The frequency graph can be a big help in this. Thanks to this post i can read it a little better now and im a little more wary of them too.
I dont listen to the sound tests Zeos posts. Wont they be skewed by the headset i listen to them on? How do i listen to them. Can anything be gleaned from them?
I dont think theres any other reviewer on youtube that as accomplished as Zeos and he seems to have more reviews on you tube than anyone else. So what other reviewers are as accomplished as him? what are the reviewers you guys listen too?
They are pretty fundamentally flawed tbh. It’s just not worthwhile imo as there are so many things that affect the final sound that it really doesn’t tell anything
I feel like there a decent amount of reviewers that do a good job at providing their perspective so I mean if you can find someone who has similar tastes and experience it can be helpful. Just watch out for obvious red flags. There is a thread on here somewhere about good reviews and people to stay away from or something similar that might be helpful to you
id really like to read that thread. Can someone link it?
Have you tried the NDH20s?
1 Like
i bought them yeah. ugh, omg, ![]() .
.
terrible, just terrible