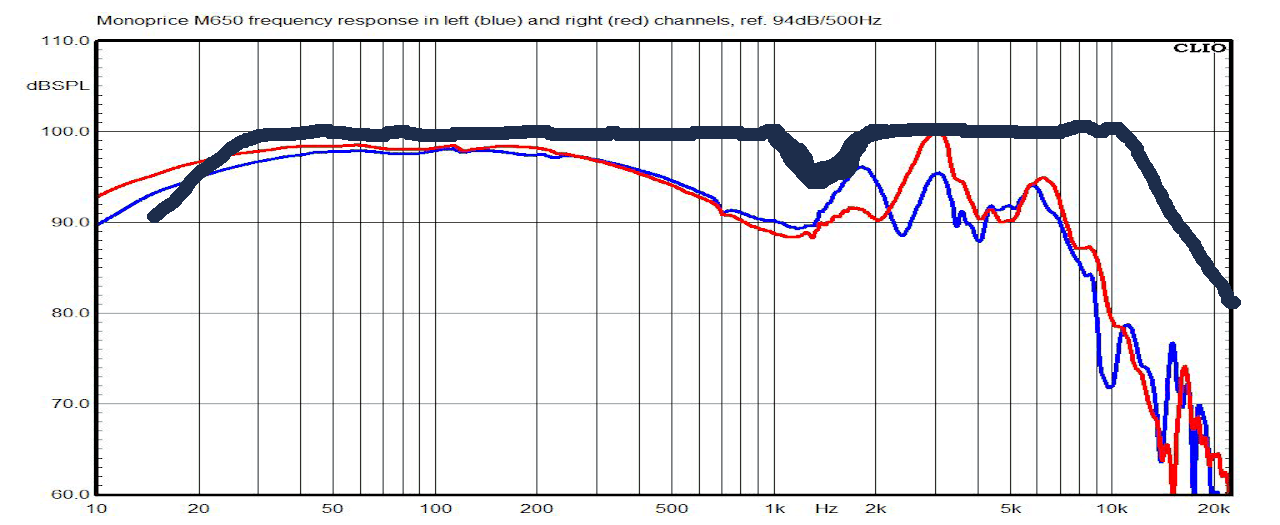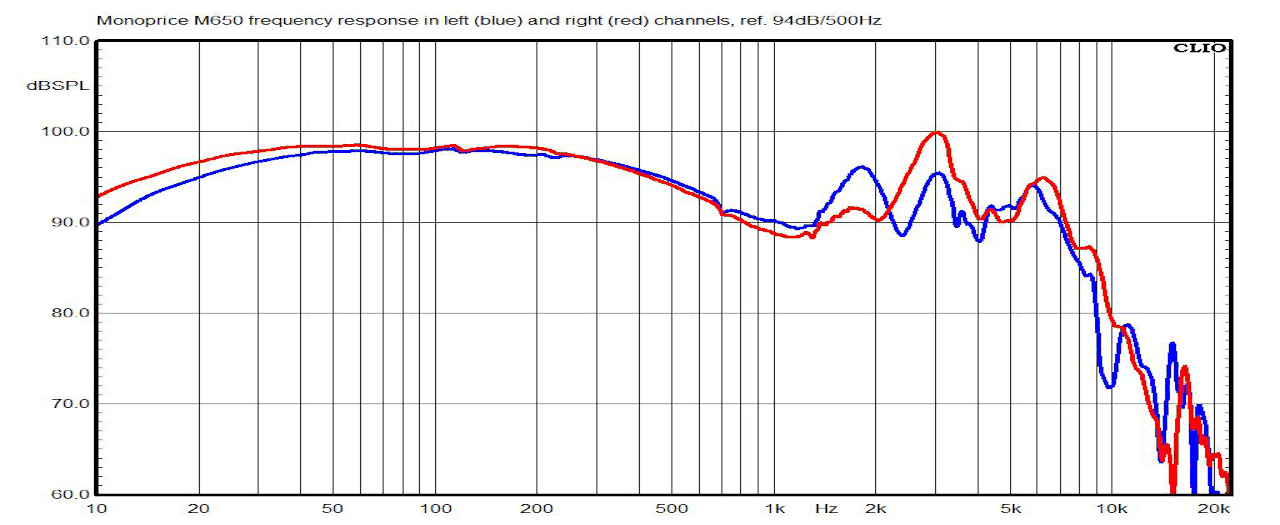
The only graph I saw for the M650s is this one. And… don’t trust it. Using SineGen :
-This graph makes you believe the hole is from… 200hz to 2khz or even 3khz.
-This graph makes you believe the drivers are “starting to die” at 7khz. Definitely, definitely not.
Seriously, for my ears, I can hear the drivers working at 15hz (even less but whatever lol) – then it’s pretty much flat everywhere from 30hz (yes) to 10khz – then starting to go down slowly until 16khz. Which might very well be where my hearing stops. The only exception is a small hole, strictly from 1khz to 2khz.
So, yeah, nothing is flat as a ruler, but my “addition” to the graph is more realistic than theirs, lol.