When it comes to IEM measurements, I understand that everything above 8k hz shouldn’t be taken too seriously, but what I am surprised about is how different measurements of the same IEM can be.
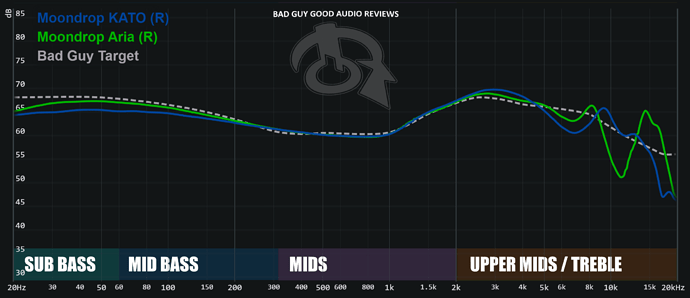
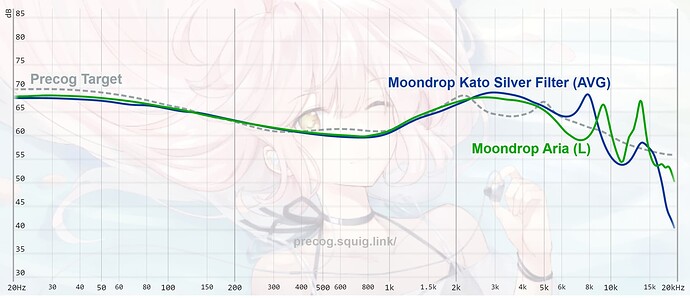
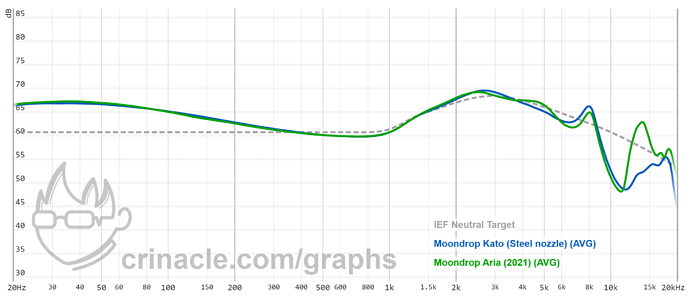
I compared the Kato vs the Aria and something was off… I compared 3 squig links and these are the results normalized to 60db (normalizing to 1000hz doesn’t make a significant difference):
While the Aria treble looks somewhat similar on all graphs, the Kato is all over the place. With crinacles measurement the Kato has huge gap between 8k and 18k even more than the Aria, while in @hawaiibadboy s graph the Kato fills Aria’s gap between 8k and 13k and then rools off completely.
Looking at all three different graphs, it seems they all work with different insertion depths leading to different resonance frequencies, so that may be one reason?
My questions are:
- is there any way to make sense of the discrepancies and still extract information from the treble measurements despite them beeing wildly different? (depending on the measurements I can’t even say whether the Kato or Aria has more treble)
- should I not only take everthing above 10k with a grain of salt but should I just completely ignore it? If the latter is the case, why is it even included in the graphs?


