What I mean is that all FR tables I’ve seen so far don’t provide vertical lines (the ones on the x-axis that keep track of the frequency for example 1k, 2k, 6k) for frequencies above 10k, like where is 13k or 17k? I am trying to EQ my 1990’s and those areas are the most problematic to deal with because of this reason.
It’m my understanding that all measurement rigs even very expensive ones aren’t accurate in the 10K+ region, they are often “repeatable”, i.e. you can’t compare measurements between 2 measurement rigs, but the relative values on one might be informative.
My understanding is the only real way to get accurate measurements for higher frequencies is to remove the transducer from the housing and measure it free field.
They don’t skip it. Think of it in the same way that going from 20 Hz to 10 Hz is reflected in the graph the same way. The amount of sonic information in those areas of the spectrum are minimal when compared to where the bulk of the sound is.
Agree with Polygonhell – I’ve certainly seen discussion about there being technical issues in this last octave of data. It was above my head, and IAC, that discussion was regarding the current generation of pro-grade equipment. Your graph comes from DIY-Audio, and Solderdude is using a home-grown flat plate rig. Plus, he partially compensates his data with a correction curve. But by all means try using it for EQ, if it doesn’t work, so be it. You then use measurements from a pro grade rig to see if that matches your pair of DT 1990’s.
And of course db_Cooper is right. The vertical lines and numbers are on a logarithmic scale meaning 1 to 10, 100 to 1000, and 1000 to 10,000 occupy the same horizontal space. But this results in a wide gap between 1 and 2, 10 and 20, etc. You can fill in those gaps as needed by calculating the percentages to assign to each 1/10 division. But what I do is to use the free graphics software on my MacBook to take a chunk of a blank area of the graph, copy and paste it back on to the graph, then shrink it down to just fit between the 10,000 and 20,000 Hz lines like so:
Here, the red rectangle is where I grabbed a chunk from and the red arrows point to where I pasted shrunken copies of it. I then used the 3 and 7 mini-lines as references to draw in the two blue lines that should now represent 13k and 17k.
there is very little information from 10k on. no musical instruments play that high of a frequency. no humans can sing that high. your ears aren’t naturally trained to really pay attention to frequencies that high. anything in a recording that even plays that high is purely for ambient effect. so graphing it out is rather pointless.
In case you need it, here is a graph done with a pro-grade GRAS45 rig. I’ve stretched it vertically to a more typical ratio, added a guesstimate of where the analytical pads would fall, and added the 13k and 17k lines, as well.
There is lots of spatial information above 10k, along with the high order harmonics from the instruments will lie above 10k. Strings, percussion, brass, woodwinds, and piano can easily reach into the 10khz + range for active information in recordings when it comes to harmonics. This range is something that I would argue is pretty important and also can be problematic if not dealt with properly. Now if that matters to you or is worthwhile measuring is a different story, personally I think it’s pretty nice to have information on what goes on in that range even if it’s a rough estimate
Not to pile on, but people on this forum have reported having significant treble sensitivities in this range, as well. They either EQ down any spikes that collide with their sensitivities out or look for electronics that present this region less brutally.
I find that bringing down 11k and specially 13k tone down a lot of problems that I have with my 1990’s I’m not sure why that’s the case but it’s very noticeable
I’ve always wondered if that’s why the harmon curve is the most popular for the masses. I’m one of those high sensitivity guys, I tried a Beyer 177X and had to get rid of it because it was painful
You’re right that the information is/can be just and important to create the atmosphere both on the extreme high and extreme low. I mean it in such a way that the amount of info in disproportionate when compared to the meat and potatoes of the spectrum. But ya, I wouldn’t wan to be without it.
Past 10khz is pretty important for clarity imo. EQ-ing Porta Pros with just a 5-10dB 10khz+ shelf or slope improves the detail dramatically for a lot of different timbres.
True, it’s not necessary to understand what the sound is like mid and bass frequencies are, but it’s a good chunk of extra detail.
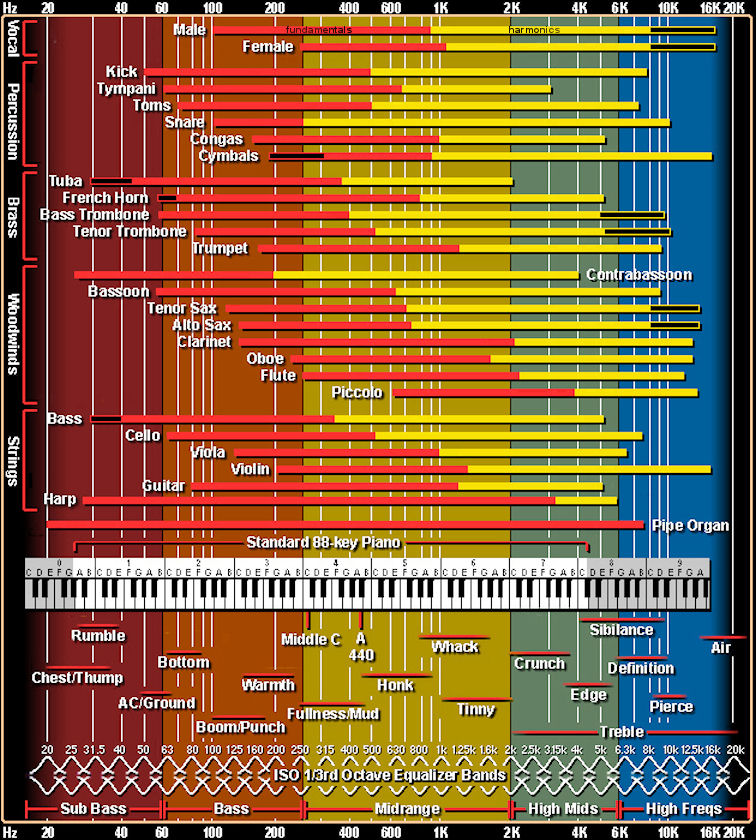
Just want to make it clear that we’re talking about overtones here when discussing such high frequencies, not the named notes that are being played. In Hazi59’s graphic, the red bars for each instrument are its range of fundamentals or named notes (such as middle C). The yellow bars are the overtones that go along for the ride with those named notes.
The overtones can often be more powerful than the fundamentals, but we nevertheless identify notes by their lowest pitched component sounds. (The combination of fundamental and overtones to a given note is the timbre of that note as sounded by a particular instrument or voice.)