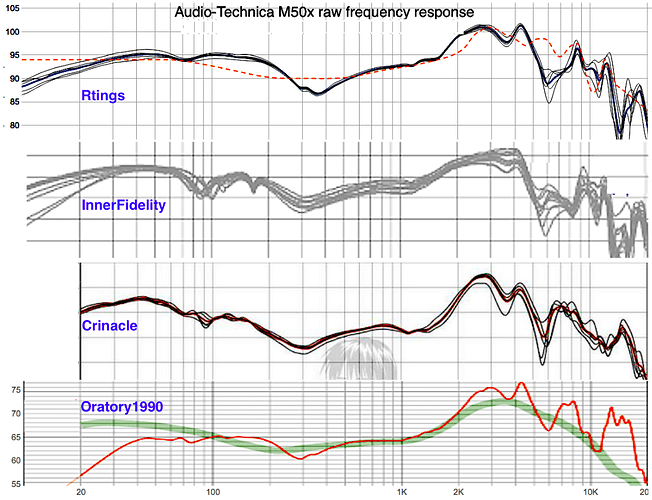
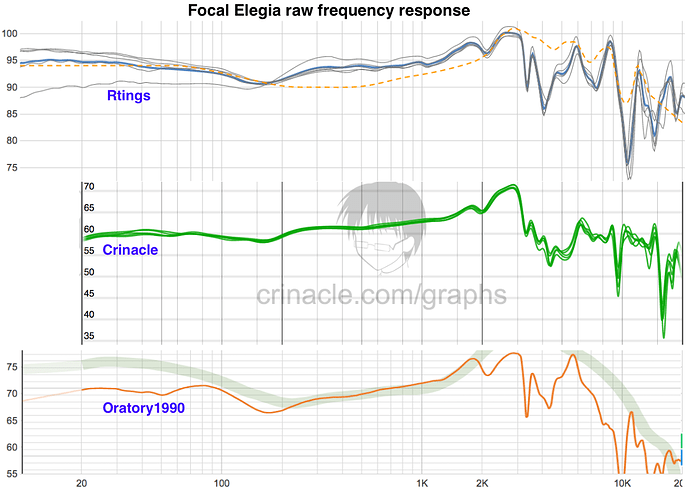
Wow, major find! Despite the rather unorthodox rig he’s cooked up his results fit in very nicely:
Plus we get some gems like multiple ZMF models. Plus we get a gem of a comparison tool. Great Christmas present for the handful of us geeks who live down this particular rabbit hole.
![]() time to look at more frequency graphs, gosh darn do I love me some freq graphs
time to look at more frequency graphs, gosh darn do I love me some freq graphs ![]()
Yep I’ve always appreciated his own reviews I just hope this leads him to do some headphone reviews
Does the Elegia have a spike at 8 1/2 kHz or a dip at 9 1/2?
How much is rig inaccuracy and how much is unit-to-unit variance?
I tend to reply on Oratory1990 a bit more due to him having the only uncompromised set of equipment. But with Crinacle having a competent portable rig and multiple headphone stores available, he’s quickly going to accumulate a lot of measurements we won’t be able to get anywhere else.
Not sure but strange oratory has such a drastically different measurement in that region
I honestly wouldn’t touch the Elegia, Stellia or the Elear, they measure pretty poorly especially for the price.
It’s fascinating how Focal can make such amazing measuring headphones like the Clear and the Elex and then make those.
The elegia is pretty great imo, the elear is not tbh, and I personally don’t like the stellia.
The elegia is very impressive for a closed back, sounds great ![]()
What FR target do you find agrees best with your preferences?
I’d say the one that RTINGS uses altho I don’t agree with that peak at 12k I’d rather not have a peak there, cuz I am sensible in that region, so headphones that measure with a dip there I am all for! also I’d rather not have a peak at 5.5-6k like they have, I’d rather have a dip there as well.
So the harman target then!
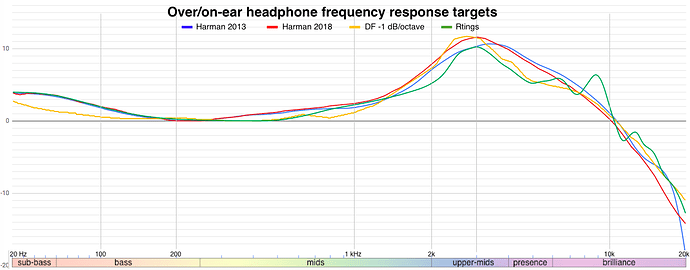
Well there are actually 3 or 4 Harman targets from various papers as they continued to refine their data. Here’s a comparison of targets that I have data for:
The 2013 Harman is their original one and popularized by Tyll. The 2018 one is their latest. The Rtings target amalgamates the 2013 Harman with a version of the diffuse field curve plugged in after 2 kHz because they like the sound better. The curve labeled DF - 1 dB/octave is what happens when you correct the well-known 2008 Hammershøi and Møller diffuse field curve with a common room gain factor to account for the effects of room acoustics on an anechoically flat loudspeaker. Choose one and I’ll add the Clear and Elegia to it for comparison. Or we could patch in one of the others to the Rtings curve to eliminate the high frequency spikes.
(BTW: notice the scaling below 100 Hz is linear while the rest of the graph is logarithmic. This is an artifact of the measuring regimen used for the AutoEQ data that I’m plotting here.)
Where do you find such graphs and such I am curious
I didn’t find them, I made them. The data is from the public domain AutoEQ project (https://github.com/jaakkopasanen/AutoEq/blob/master/results/INDEX.md). I import that into the on-line Google spreadsheet and use its graph creation tool. Then I add my own labels.
But since this is a Crinacle thread, we should probably use his data via his handy-dandy graph comparison tool:
It just lacks the target curve for reference.
Those Clears look like they are not sealing very well on the measurements rig that subbass should be pretty flat not rolling off ![]()
Agree. Tyll and Oratory1990 show at most only about a 2 dB drop.
crinnacle is only doing one channel and because his system is non-typical, says his reports will likely differ.
Yep. That’s very modest of him. But what I’m seeing in graph after graph is how little difference there is between his results and the big rig dudes. Very impressive.
crinacle knows what he is doing and his graphs are likely to improve I just hope headphone reviews grow out these


