wink wink fan 2 ![]()
From what I’m seeing in their newsletters they are generous with VIP offers on new releases. But if you miss those initial offers you are SOOL
1 Like
I have yet to see Penon discount their own IEMs although their AliX store is having a discount on Yanyin IEMs for 11/11
Decided to bust out the Penon Vortex after listening to my IE600s for a couple days and I forgot how good they sound! I still prefer the IE600s over them but boy are the Vortex’s fun and it definitely doesn’t feel like its a 3x difference in price between them. The biggest differences I notice is the IE600 has a lot more sub bass, where as mid bass and mids are much cleaner. You can feel the mids a lot more in the Vortex, they sound meaty and have a very unique texture that is addictive while still keeping treble clean. The bass just drops off though when stock which is unfortunate and why I think I liked the vent mod so much.
4 Likes
How does the Vortex compete tech wise? IE600’s a detail beast so I’m curious ![]()
Good question! The vortex is definitely a step below. The IE600 is cleaner and more refined, resulting in better detail retrieval. While the Vortex is fairly resolving, the presentation is a bit more raw and analog by comparison
5 Likes
KiiBOOM Allure (1 DD, $99)

Not the best glue job


Nice big box


KiiBOOM Allure frequency response graph (Squiglink - IEM frequency response database by Harpso)

First impressions

Now back to listening…see you later
7 Likes
Does anyone have first impressions of the Mangird Xenns Top? They seem to use the same one 10mm beryllium-coated dynamic driver for bass from Xenns UP.
Oh wow! I missed that it was Bery. Dang…
Hope we find something out about it before 11.11 ends
From that picture, we found out QC/QA might be a thing. I’m not blind dropping $100 on that
1 Like
Can someone explain to me how to translate these kind of graphs to the ones we are all used to from squicklink? Where the bass rises up to 65-70 for example…
Manufacturers always post other graphs and I have no idea how to read them
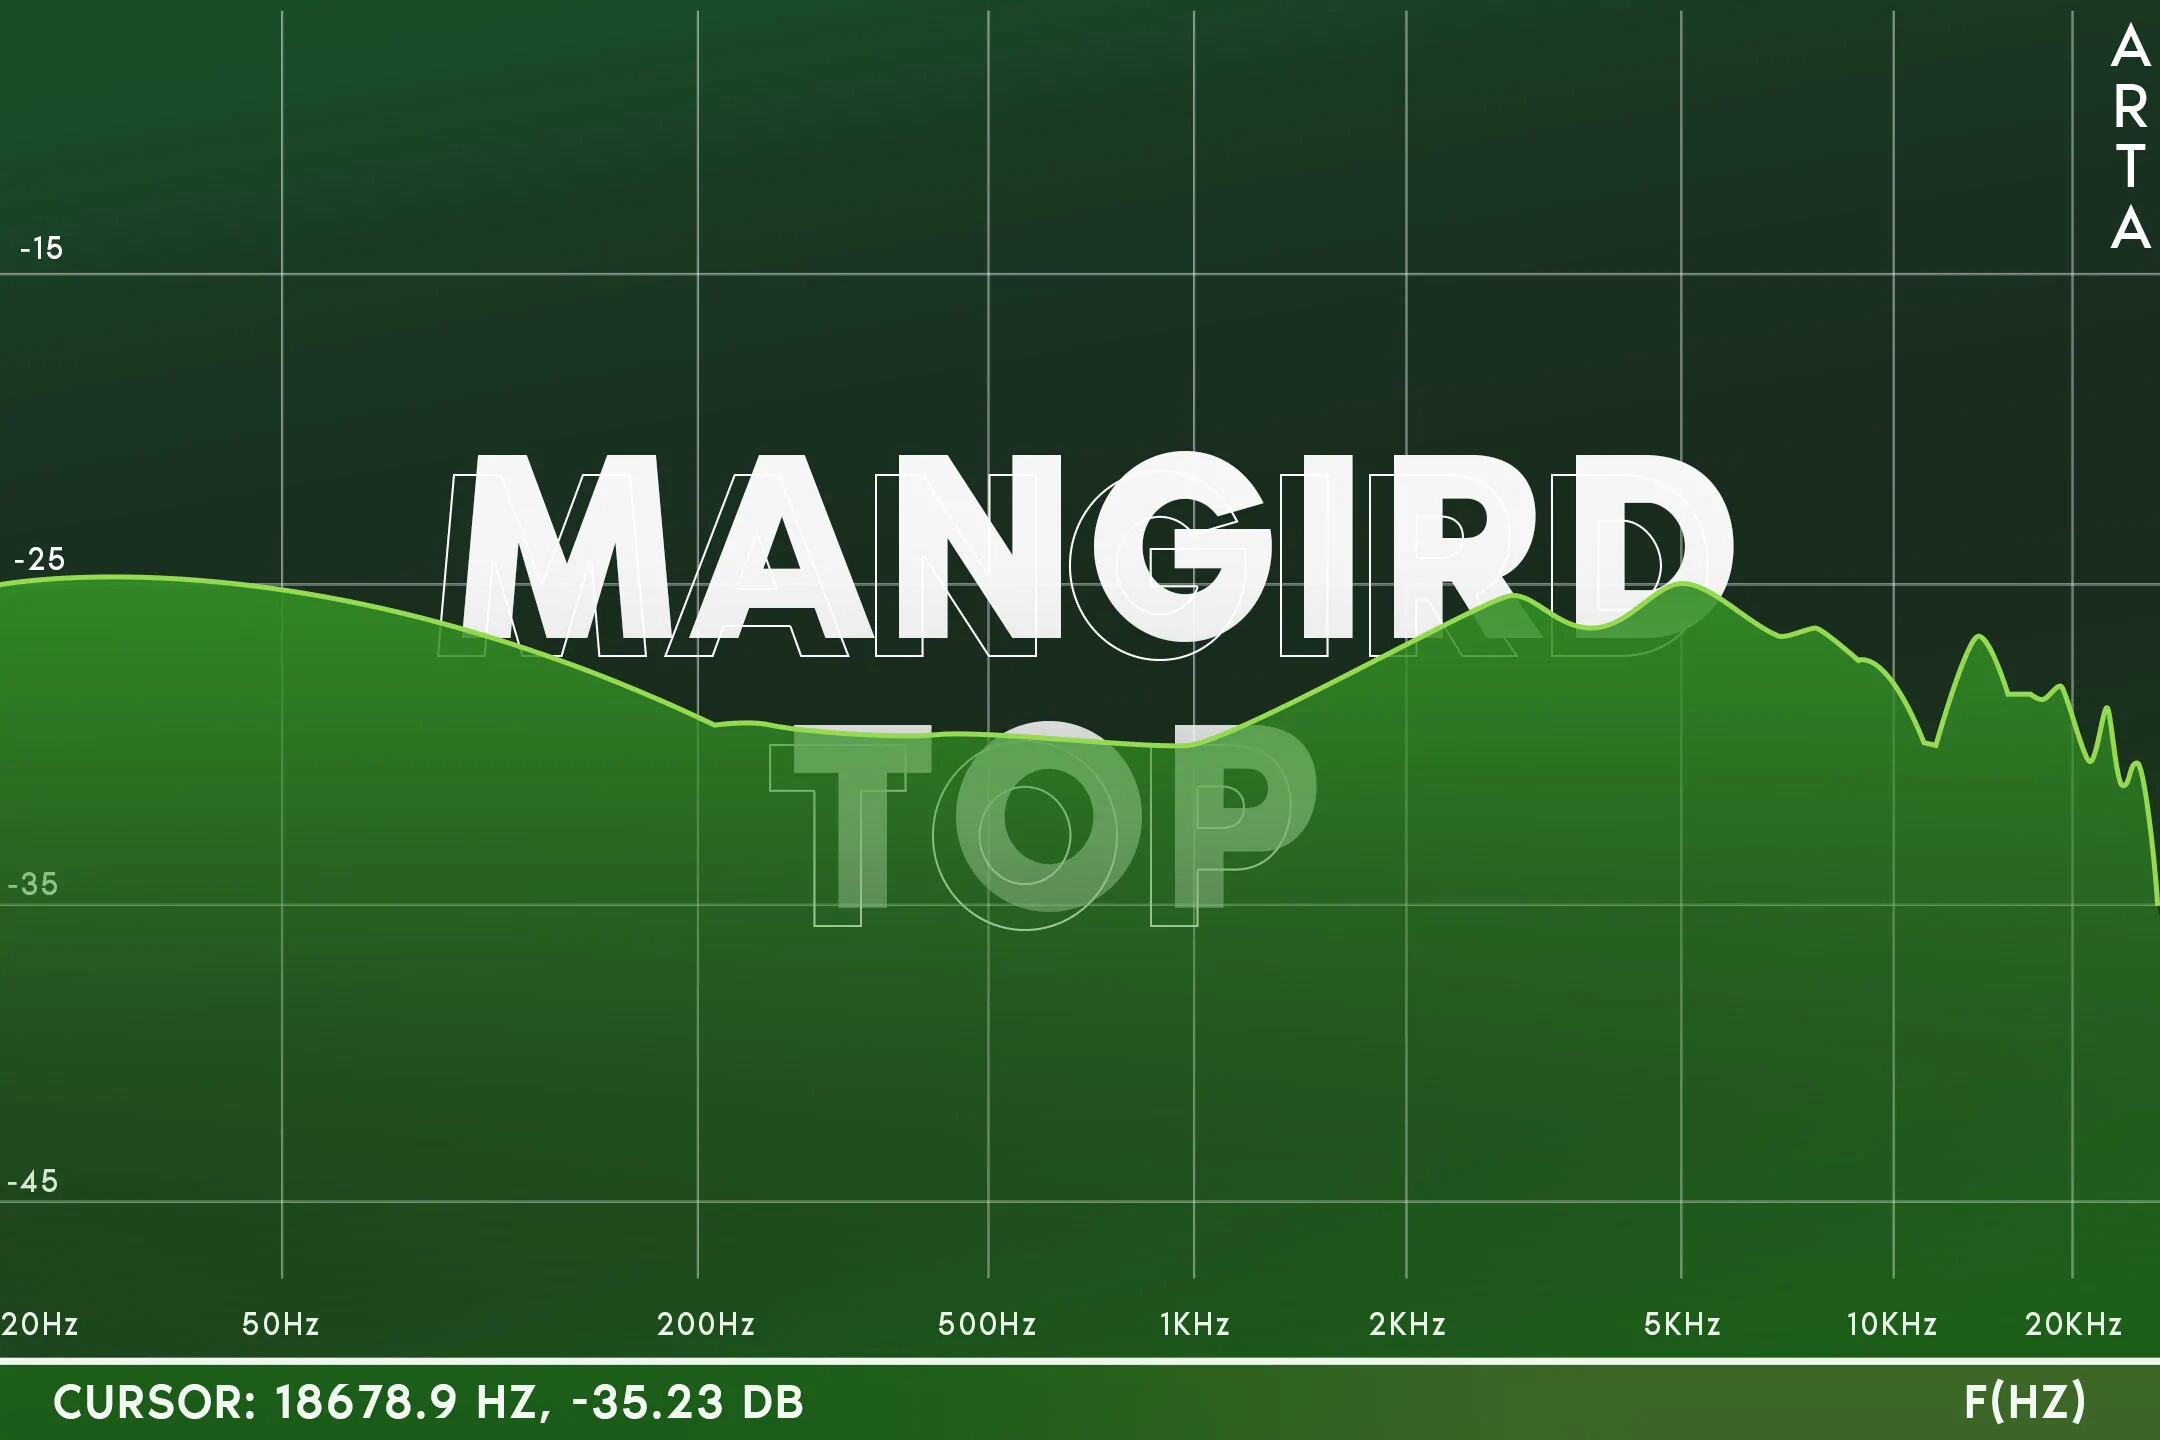
This is exactly same type of graph, but it would need to be normalized along axis and even overlapped on some other squiggs.
I think it is normalized at 1kHZ being -30dB (it looks like it) → you refer to that point as zero and see how elevate is the bass (+5dB at 50Hz, +2 at 200 Hz), how much there is of a gain (+3dB at 2kHz, +5 at 3kHz, +5 at 5kHz) etc
worst case scenario you could even overlap it on a screen ![]()
1 Like
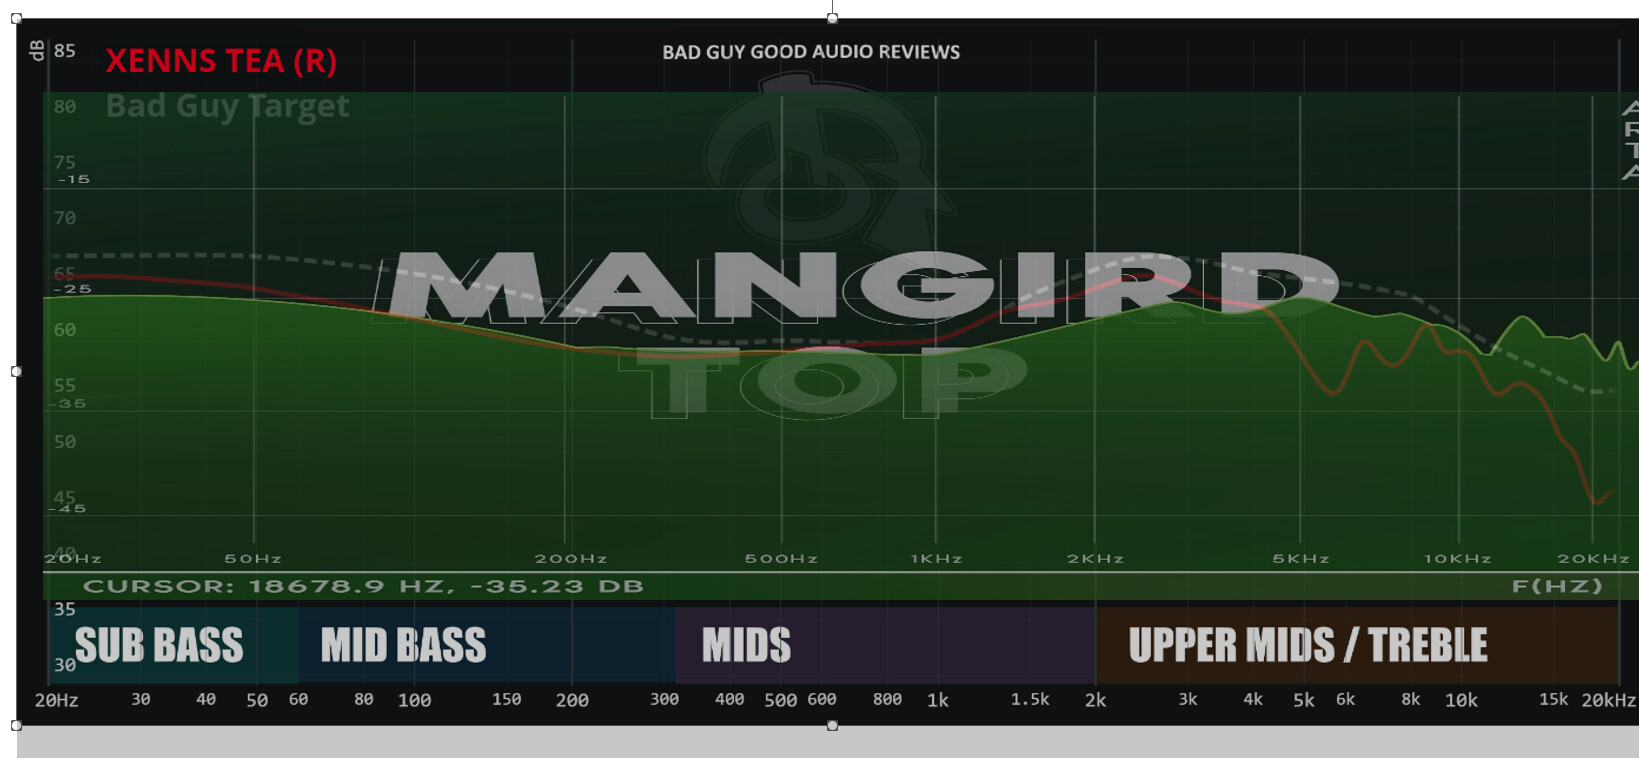
I dont know how visible that is but it is dropped on graph of Tea, normalized at 500Hz (there are slight misalignement in the logarithmic scaling used
6 Likes
I still don´t get it haha, but thanks for the translation picture ![]()
Looks way too weak in bass for me ![]()
I don’t know how do you interpret the graphs from squiggs, but all graphs are made in relation to some base point (they are relative) at given volume settings.
Very often the measurement starts at pushing a 1kHz sine wave with the IEM in the coupler and adjusting a volume until you get some desired value (often 60dB SPL). Then you do a swipe of all frequencies from 20-20000 Hz with the volume potentiometer set at same value (same that gives you 60dB SPL at 1kHz). Now you could see what is the signal level of different frequencies with this particular volume - just like you would listen to music. Some frequencies would be emphaissed (like this 70dB you mentioned before - so relatively it is +10dB from 60dB base), some would be weaker (like for example 50 dB - so relatively -10dB from 60dB base). You very likely dont adjust the volume in duration of the song so this is quite telling on how you would receive the sound (though not perceive) with the IEM in real life.
If you look at Mangird Top graph it was normalized at some strange value somewhere up not visible on the Y axis of the chart, so all measured frequencies were presented in negative notation.
It does not matter though, as if you would take this -30dB from the graph as your ZERO point all the rest of values are in relation to this zero - +5dB at 50Hz, +5dB at 3kHz. Just like in Squiggs where their zero is 60dB SPL.
4 Likes

“The sales are coming from INSIDE THE HOUSE!” ![]()
7 Likes

4 Likes
Units still being finished, as far as I know.
Strange, the page of the item mentions nothing about not being ready… But I’ve confirmed with them. That’s why no graphs are out yet, no samples flying.
2 Likes
Yeah, sure.
I’m assuming the 1k hits right in the mid of the rectangle, so on their graph should be 20db, which I will now consider 60db (squig normalization @ 1k hz).
This graph translates into a 65 DB @ 20hz, around the same value at its pinna gain peak (3k hz) and brilliance boost (5k). Past 8k, I won’t comment.
It will be a warm tuning, especially the vocals. Let me come back to u in a min