Frequency response graphs are both helpful and imperfect. They:
provide useful information about the technicalities of a speaker/IEM/headphone
give some insight into the tonality of a speaker/IEM/headphone (if you know what you’re doing)
give an incomplete picture of what a speaker/headphone/IEM sounds like
often involve curve fitting to not-always-specified standards
can be easily manipulated for marketing purposes.
Crinical recently posted a bit of a tutorial, in pretty accessible language, on how to read headphone and IEM frequency response graphs, addressing all of those points:
A lot of people don’t like measurements, and I can understand why. This stuff gets confusing and is sometimes a bit too ‘into the weeds’ - I’m guilty of that for sure. But, FR measurements from industry standard rigs are currently the best visual indicator for sound quality - and they’re also better and more reliable than sound demos. They’re not all there is to it, but at the very least they can tell you if something is going to sound bad. More importantly, if you’re unsure what to make of a given perspective (we’ve all got our biases and preferences), measurements do a good job of cutting through that.
So far, in my experience the biggest limitation on measurements is that they can be difficult to understand and analyze properly. Now, I’m not an ‘objectivist’, or at least not the hardcore variant of that - but I’ve seen much of the resistance to measurements come from a lack of understanding for how they work. Even just distinguishing between raw and compensated measurements asks a lot of the audience, and so a big part of my project is to help people be able to make sense of them better. It would be nice if we didn’t have to just rely on alignment with a reviewer’s preferences to be able to make decisions on equipment.
One last note on that - I don’t think we’re at a point where we can just look at data and say “here’s everything there is about how the headphone sounds”, but the folks over at Harman research have shown that at the very least measurements are predictive of preferred sound quality - with a strong correlation between even spectral balance or ‘neutral’ and listener preference (what that ends up being is still up for debate).
Could you elaborate more on this? Cause i would think if two different sets of headphones had similar FR, that would not dictate which one had the best sound quality?
Yeah so this is an important point. Just because two headphones have the same FR, that doesn’t mean they are equivalent in terms of sound quality. Certainly the tonal balance would be the same, but this doesn’t tell us about what many (myself included) have called ‘technical performance’. So stuff like detail, soundstage, dynamics and so on. You will likely encounter people who disagree with this, and say FR is all there is - but so far this is contrary to what I’ve found.
Now to be clear, this stuff may actually be captured by measurements of some kind, but we’re not really doing an analysis of that to properly correlate it with the experience. Even the most hardcore objectivist reviews so far aren’t providing an analysis of the data that is exhaustive to the experience. Now of course, they can turn around and say “the rest of it is placebo”, but I think the more reasonable answer is that yes, there is something there that people are identifying.
While it may be there somewhere in the data - maybe in unsmoothed FR even - you can’t hold up a graph and say “here’s the detail in this headphone where it’s not there in this other headphone” the same way you can talk about tonal balance. Moreover, it’s not clear yet as to the value of many of the additional metrics that exist, like CSD, THD, square wave, impulse response, group delay and so on. There’s a lot of debate - even within the more objective communities as to what that stuff means as it relates to the experience.
^thieaudio phantom mesurements
i mean to see the hype train on the thieaudio straight up become a dumpster fire after actual measurements were posted is very telling. measurements dont tell everything but i would say they give a general direction of the foundation of the sound and if that is bad then its hard to make up for with “intangibles”. the gl2000 measurements dont seem near as bad as the thieaudio however so thats good. seems like it will be controversial however over time. unlike the sundara and 6xx which both measure and review well making them an east recommend. this will be interesting to follow
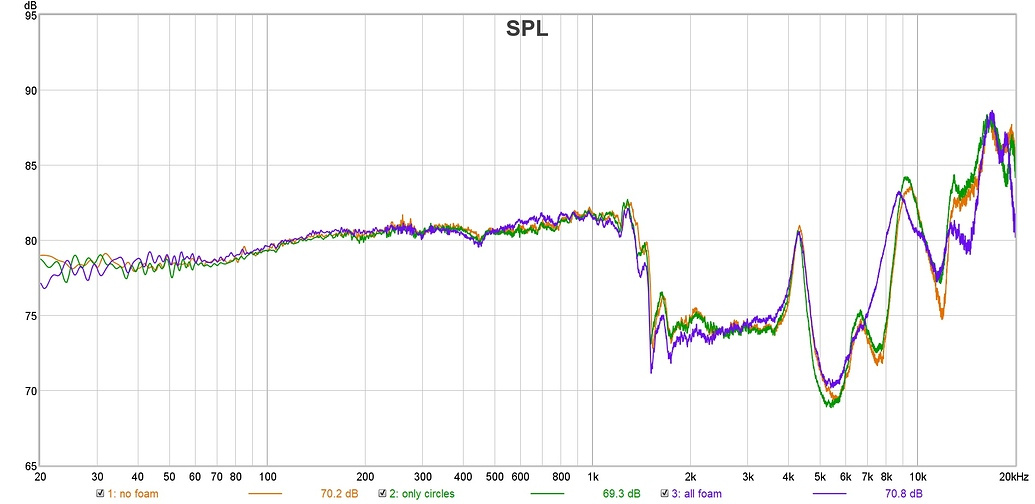
One problem I see stems from the way headphones are fed during a measurement.
AFAIK (please correct me if I am wrong here) they get a fairly clean sine wave of rising frequency and then the SPL at the current frequency is measured.
This completely ignores power required to achieve those measurements (which many would describe as “amp picky”).
FR-measurements completely ignore all sorts of time domain behaviour, (like dampening) or interference behaviour (music is not a single sine wave).
I can tell you what the argument for that is for why a FR graph might capture that if you want, and I can even tell you I disagree with it, but this discussion really should be moved out of the GL2000 thread.
The usefulness of this information is debatable. Basically, the scientific orthodoxy on the subject would be that because headphones are minimum phase devices, time domain information is proportional to frequency response information. So in short, if you can fix something in the FR, you end up fixing issues in the time domain.
Now, I’m of a mixed opinion on this because there are good arguments pointing both ways on the subject, and there’s worthwhile discussion to be had when it comes to ‘false nulls’ and certain other examples.
But, at the moment it’s not conclusive. Check these links for more info on the subject:
First, thanks @ResolveReviews for posting this. It’s a very thoughtful post for an interesting discussion.
How do we know this? Why are they the best? I suppose they could also be the best but in reality just be the least bad, right?
This is a large part of it for sure. As one who has formally studied math and science education, graph reading and data analysis are weakpoints population-wide on a variety of issues. However, it can also be true that we can accurately read and understand data and that data still doesn’t tell us much. Unfortunately I think FR graphs fall into that latter category. I’ll add though that I applaud the way you take the time to explain the interpretations of FR graphs. I think that’s well done and helpful.
A further complication with measurements is humanity simply doesn’t fully understand how perceptions are formed in our own brains. The images projected on our retinas do not scale proportionally with size in the same way our visual perceptions of size differences scale, for example. Similarly, we don’t understand how our brains calculate spatial sound cues on the fly. The brain does a lot of interpretive work we don’t fully understand yet. Connecting measurements to our perceptions is going to be a huge hole in the “objectivist approach” until we can get those things figured out. I realize that you aren’t a full-on objectivist so that comment is directed at you specifically, just a general comment about the subjective-objective spectrum.
Blasted paywalls! This sort of thing frustrates me. The results of scientific discovery are not things that the average person should have to pay for, IMO. But that’s a completely different discussion…
So in my conversations with people who are far more knowledgeable on the subject than I am (Oratory1990 and Mad Economist), the consensus seems to be that FR contains quite a bit more information than our basic analyses of tonal balance and target adherence/deviation typically report. What’s more, there are additional tests with FR that reveal information about how a headphone behaves acoustically that we’re not doing when evaluating tonal balance - stuff like air gap behavior for example.
My take is that while it’s not telling us everything, FR has the potential to be the most useful metric we have - even if the current lens through which it’s examined isn’t using it to that potential just yet.
Cool. Thanks for clarifying. I think I can get behind that; that there is more info in the graphs than there is at first blush and that we’re not getting out of it all that we could. I would still caution that it can be the most useful and still not be very useful in a broad sense. Thre’s also the risk of “data mining” which often leads to showing relationships that have no real-world impact. However, you’ve already acknowledged that FR don’t tell us everything so I appreciate you also communicating that they must be used with caution, too.
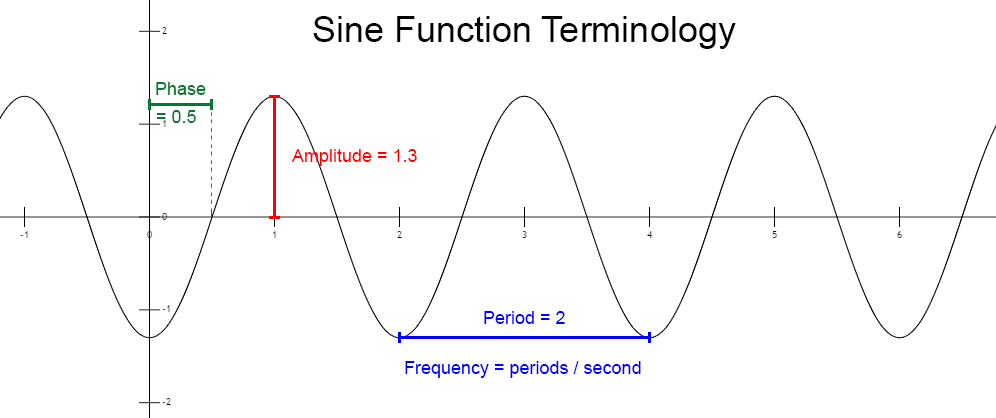
Just so I don’t mess this up (because I come from an engineering perspective and have to do some translation/mediation English↔German):
These terms still apply to all things here:
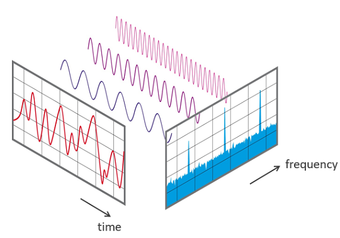
In words, given two dimensions (the common form to share information unless spoken word), we can present the relationship of two factors (I am aware mathematics can model n-dimensional things, different topic).
I personally dislike any attempts at 3D-representations. Even with dot-grids in them, it is nearly impossible to accurately tell what the value is supposed to be.
Again I think this would be more relevant if not for headphones being generally (in most cases) minimum phase. Where it gets weird to me is that there are some counterexamples, especially in more recent years. But then again, it’s also not clear at what threshold this stuff would be audible. Maybe these are situations where they’re not completely minimum phase, and then we do have a reason to care about that stuff. This is an extremely complex subject - because as it’s been pointed out, this gets even more tricky when anchoring certain data to perceptual faculties - and one that I need to defer to people like Oratory and Mad Economist on.
The argument (which I think is flawed - see below) is that there for any given finite signal there are equivalent time and frequency domain representations, so time domain effects are fundamentally captured in a frequency response.
The reason I question that validity is it makes a lot of subtle assumptions.
The first as you’ve pointed out is that it assumes that a transducer reacts exactly the same to a combination of frequencies as it does to a single frequency in a sweep (which is almost certainly not true)
It assumes you can actually measure across the useful frequency range with enough granularity/accuracy, and that’s simply not true if any of the signal is in the high frequencies.
It assumes that only audible frequencies have an effect on hearing - Just because I can’t hear a 20KHz Sine wave doesn’t mean I can’t differentiate between a 0.05 ms slew rate and a 0.01 ms slew rate. I’ve never seen tests of this.
It assumes that if those time domain responses are captured on a FR graph that they are represented in some simple identifiable fashion, which I’ll pretty much guarantee they wouldn’t be.
It also as a test clearly cannot identify how resolving a headphone is, which implies timbre, micro detail, compression, etc, etc aren’t captured.
It’s a tool it might even be the most useful one, but it’s not a panacea.
I’ve said before I like lots of headphones that do not have a Harman or even vaguely close to it response, I don’t EQ, but to me the FR isn’t one of the critical aspects of a headphone as long as it’s not totally broken.
This is debatable. When you look at an unsmoothed FR, there’s a lot more information there, and there is a chance that this stuff is actually captured by it. We’re really just analyzing it for tonal balance, and that’s kind of the problem. But the flip side is that it’s really hard to correlate something like detail or overdamping or ‘dynamics’. How do you determine among a wide range of individuals that they are indeed identifying the same qualities when using qualitative descriptions? I’m not saying it’s not doable, just that it would take some resources haha.
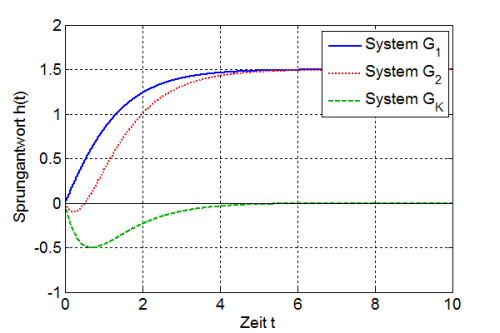
Just for context:
Blue Line: Minimum Phase (invertible to negative half plane)
Red line: Non-minimum Phase
Green line: compensation to make the red line minimum phase
I could imagine a planar headphone presenting a minor capacitive load, at sufficiently high sensitivity and sample rate, you might capture that responding to the over/undershoot of an op-amp based driver. Just shooting in the dark here though!
But not at the horizontal scale that is often chosen.
1Hz is fine with 2s per division, 1kHz needs 2 ms per division, or a thousand times what 1Hz needed.
I can essentially make a sine wave appear like a triangle by choosing the horizontale scale too wide.
Being overly analytical, I’ve been trying to correlate a lot of what I hear on more expensive gear, that doesn’t necessarily measure stunningly (not just Tubes), and how you would measure it.
My current theory (and I certainly don’t have enough time or equipment to build useful experiments) is a lot of what we consider higher performing is a chains ability to represent small details in the presence of louder highly dynamic passages. This is basically hearing a room or highly resolving etc.
Now I’ll admit I’m assuming Timbre and some other measures are related to this (and I could be wrong) but given the test is fundamentally a frequency sweep at a fixed volume, I’m not sure how it would measure that.
The other issue is that the FR graph is only really useful if the data contains a signal and it’s identifiable. It would be relatively easy to determine if there is any signal is there with enough raw data, and some hand labelling. It’s the first step of any Machine Learning process, and all the techniques are applicable.